Esta guía sobre soldaduras en moldeo por inyección explica aspectos prácticos que deben tenerse en cuenta a la hora de seleccionar los materiales, revisar el diseño, fabricar el producto y tomar decisiones sobre el abastecimiento.
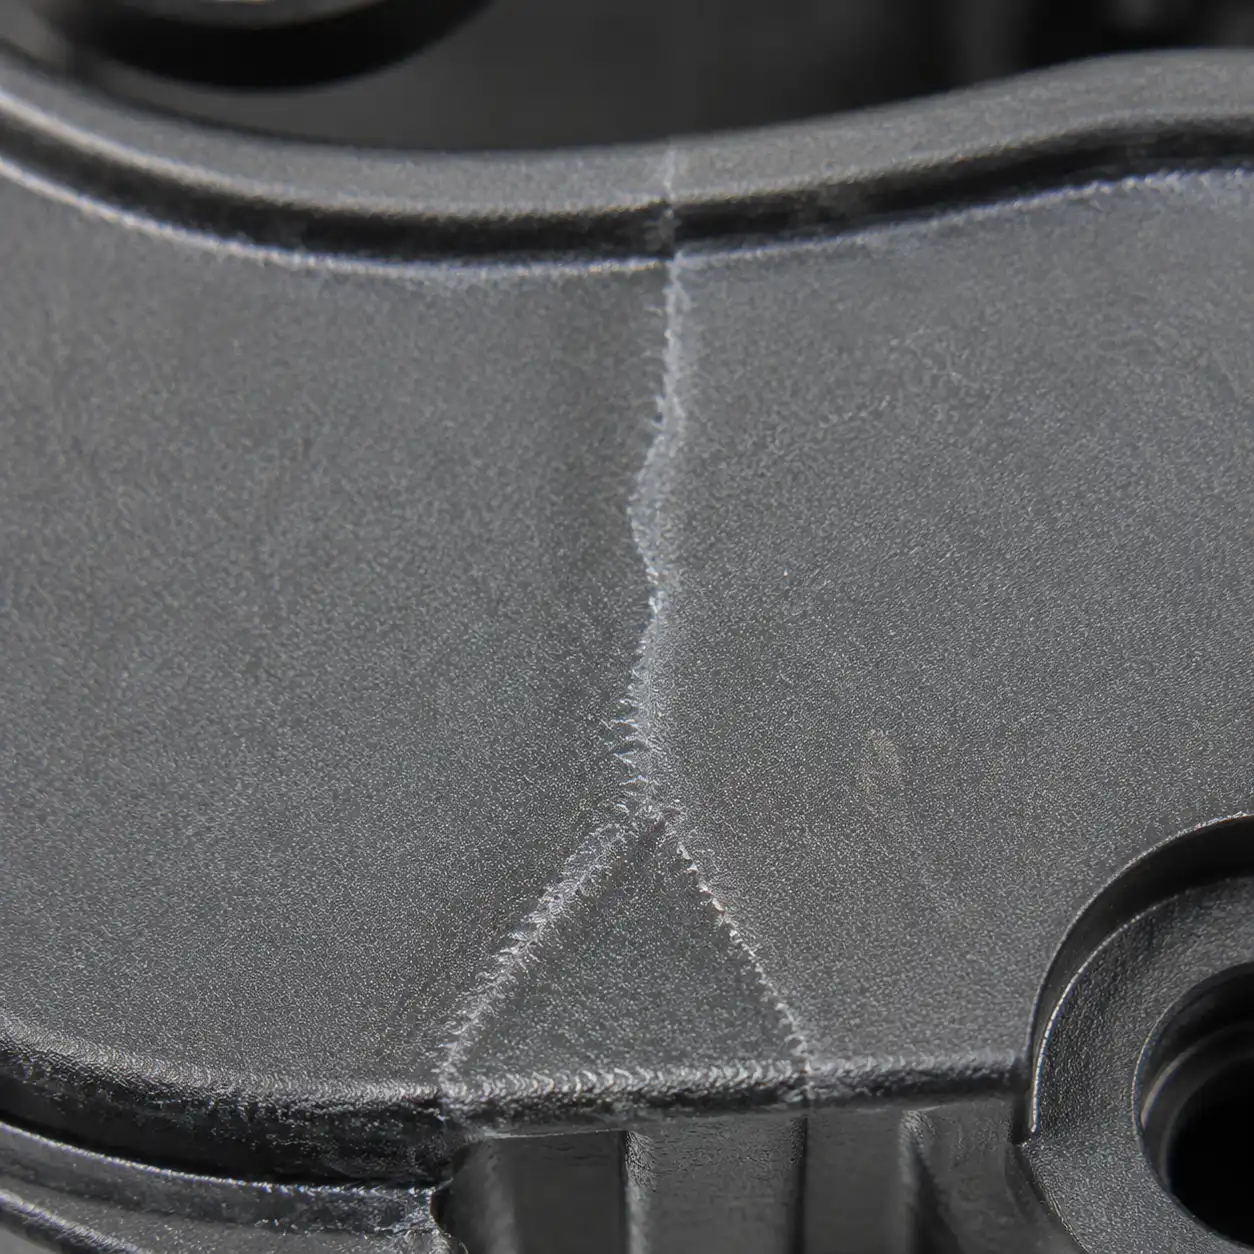
¿Qué son las líneas de soldadura?
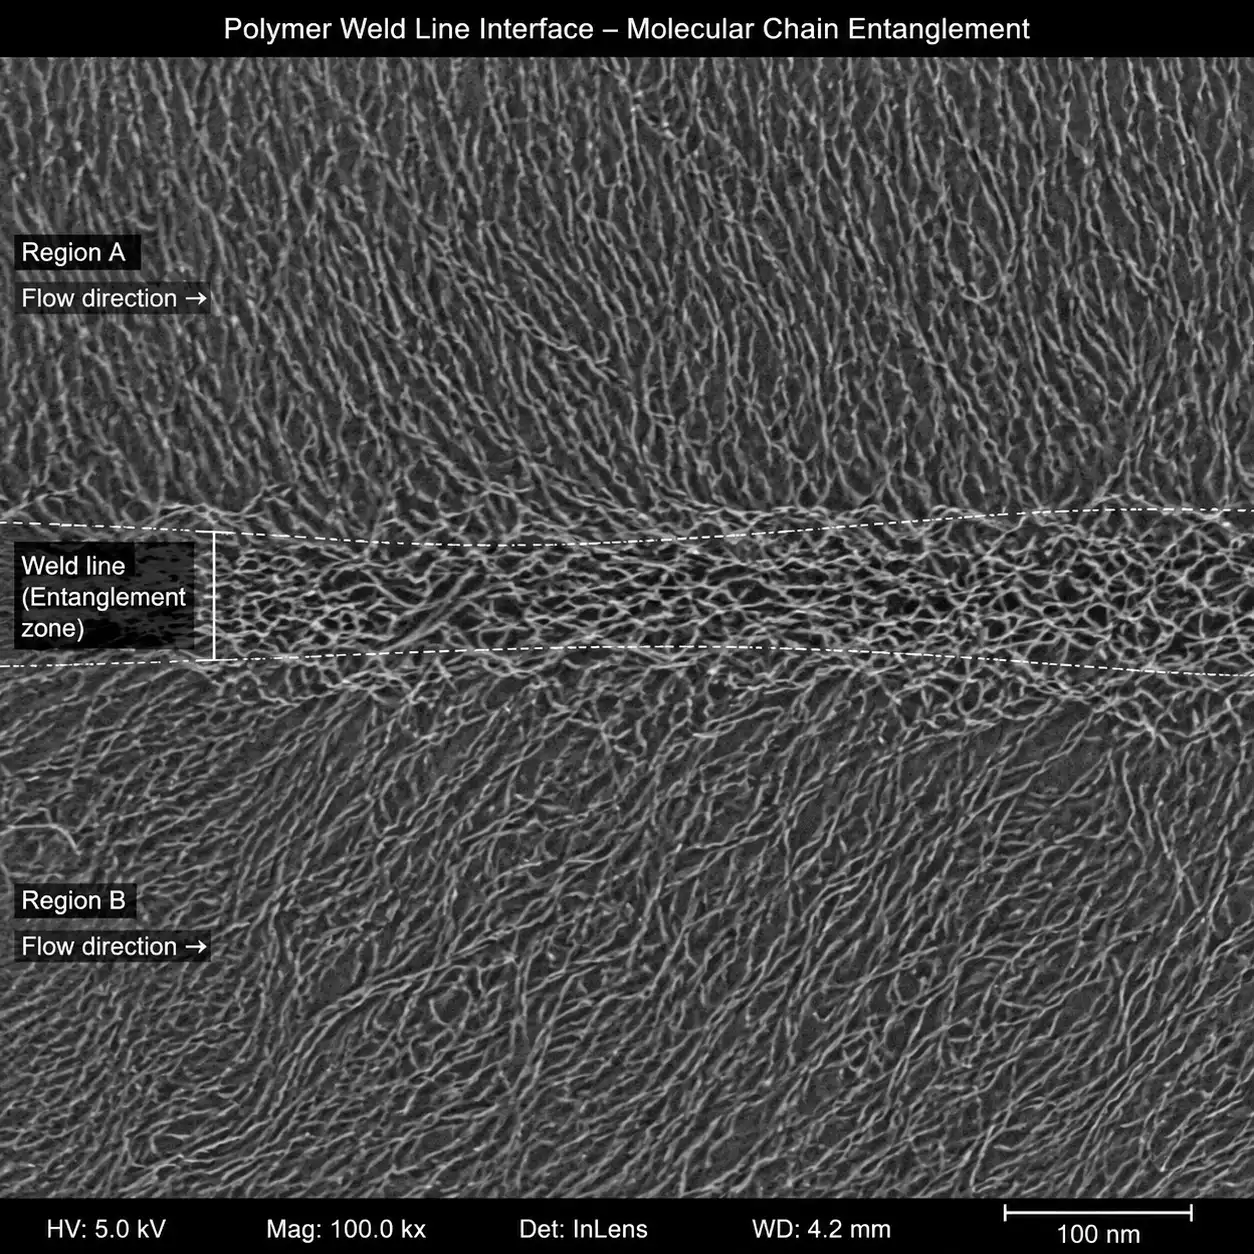
Una línea de soldadura (también denominada «línea de unión») es un defecto lineal que se forma cuando dos o más frentes de flujo de polímero fundido se encuentran durante el proceso de moldeo por inyección y no logran entremezclarse por completo a nivel molecular. El resultado es una línea visible o una zona mecánicamente más débil en la superficie de la pieza y, lo que es más importante, a lo largo del espesor de la pared.
Las líneas de soldadura se definen mecánicamente como zonas en las que el entrelazamiento de las cadenas poliméricas es incompleto. Cuando los frentes de flujo convergen, las moléculas de polímero situadas en el frente que avanza ya han comenzado a enfriarse y a orientarse en paralelo a la dirección del flujo. En el plano de encuentro, las cadenas procedentes de los lados opuestos simplemente se tocan, en lugar de interpenetrarse, creando una frontera que se comporta como una microfisura bajo cargas de tracción o de impacto.
Entre los defectos del moldeo por inyección, las líneas de soldadura son especialmente peligrosas, ya que a menudo pasan la inspección visual en la superficie, al tiempo que provocan una reducción de la resistencia mecánica local de 20-70%, lo que las convierte en las #1: defecto estructural oculto en piezas moldeadas.
¿Qué provoca las líneas de soldadura?
Las líneas de soldadura no son aleatorias. Se forman allí donde el flujo se divide y se vuelve a unir durante el llenado de la cavidad. Hay tres situaciones principales que explican más del 90% de los casos de líneas de soldadura:
1. Encontros de frentes de flujo tras una obstrucción (orificio o inserto)
Cuando el polímero fundido se encuentra con un pasador central, un inserto o cualquier obstáculo en la cavidad, el flujo de material fundido se divide en dos frentes que rodean la obstrucción y vuelven a unirse en el lado posterior. Este es el caso más habitual de línea de soldadura, presente en prácticamente todas las piezas con orificios, ranuras o insertos metálicos.
2. Convergencia multivía
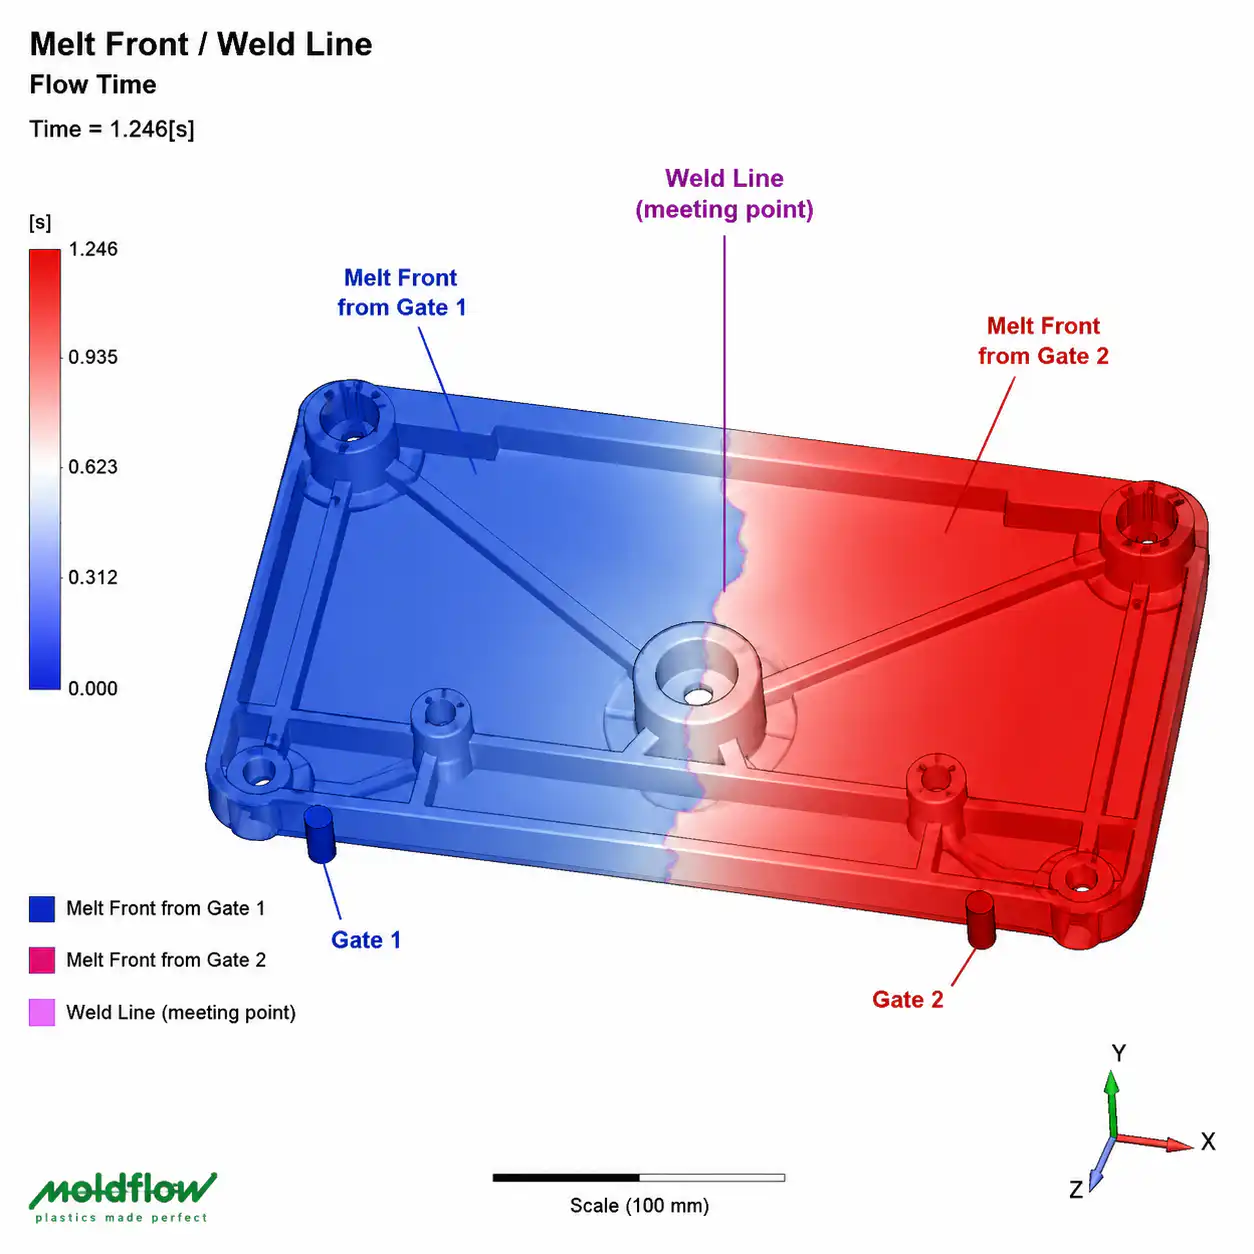
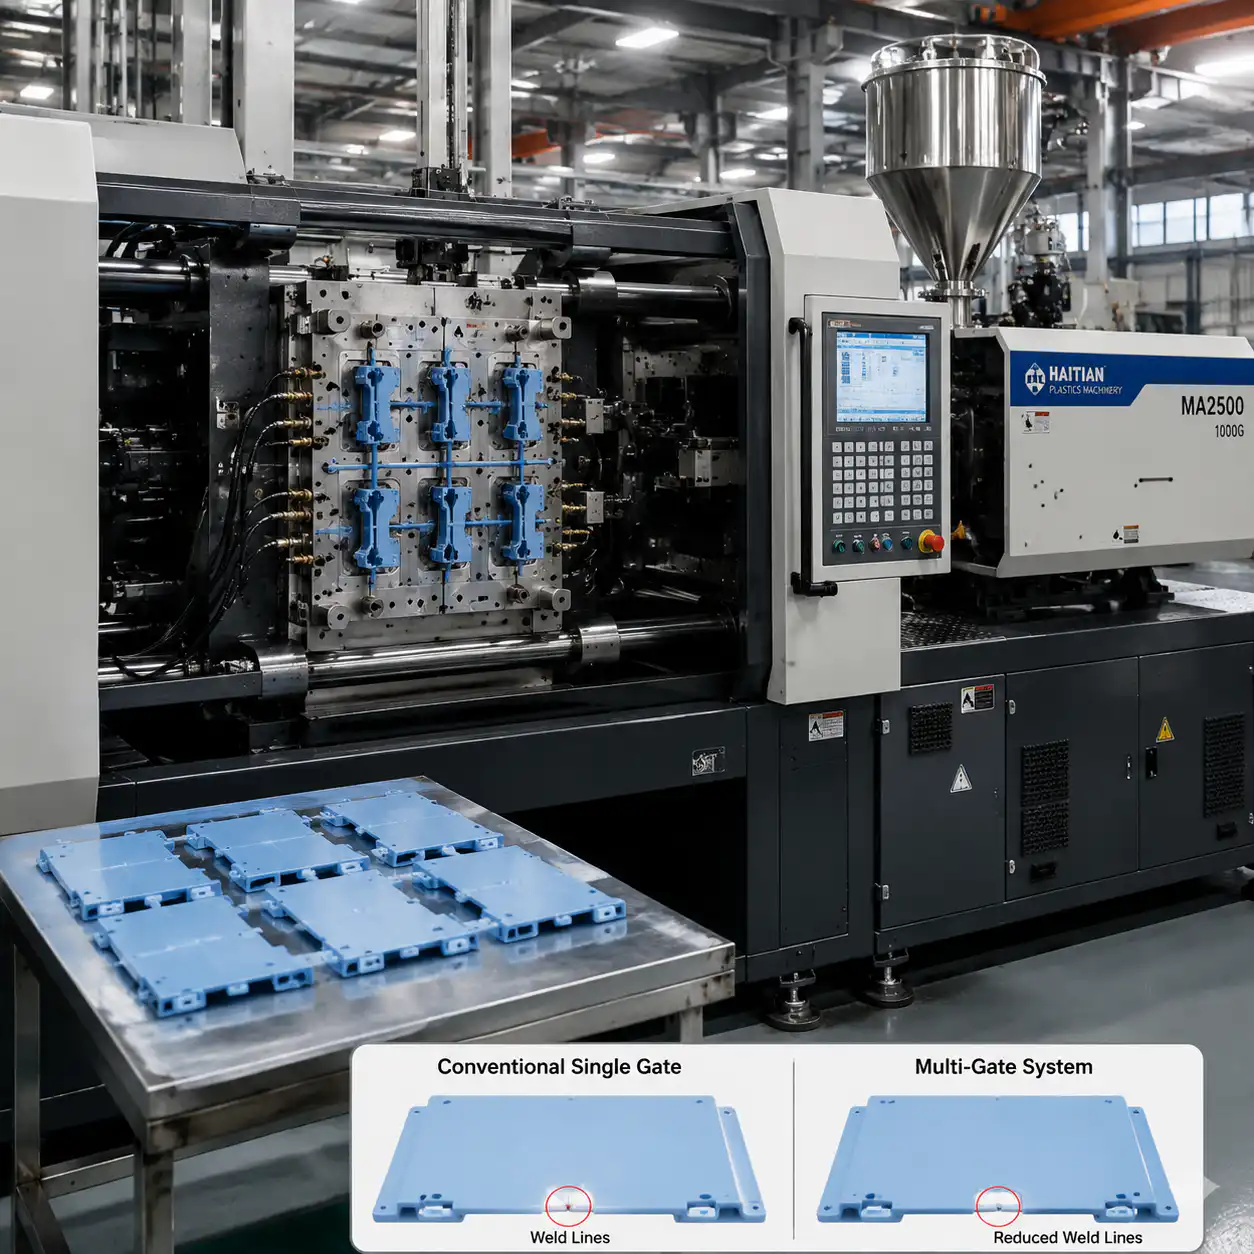
Cuando se rellena una cavidad a partir de dos o más entradas simultáneamente, los frentes de flujo de cada entrada acaban por encontrarse. La ubicación y el ángulo de este encuentro definen la línea de soldadura. El uso de un gran número de entradas para el relleno de piezas de gran tamaño garantiza prácticamente la aparición de líneas de soldadura, lo que hace que optimización de la disposición de las puertas una decisión de diseño fundamental.
3. Variación del espesor de la pared
Los cambios bruscos en el espesor de la pared provocan diferencias en los caudales. El polímero de la sección más gruesa fluye más rápido (menor resistencia), adelantando al flujo de la sección más delgada y creando una línea de soldadura donde ambos frentes se vuelven a unir. Este mecanismo es especialmente insidioso, ya que a menudo se pasa por alto durante el diseño de la pieza.
Tipos de líneas de soldadura: líneas en frío, en caliente y de unión
No todas las líneas de soldadura son iguales. Comprender esta diferencia es fundamental para llevar a cabo una evaluación adecuada de los riesgos y diseñar una estrategia de mitigación:
| Tipo | Temperatura de formación | Apariencia | Retención de la fuerza |
|---|---|---|---|
| Línea de soldadura en frío | Por debajo de la temperatura de fusión | Ranura en forma de V muy marcada en la superficie | Pérdida de 50-70% (en el peor de los casos) |
| Línea de soldadura en caliente | Por encima de la temperatura de fusión | Una línea sutil, quizá invisible | Pérdida 10-30% |
| Línea de fusión | Temperatura cercana al punto de fusión, ángulo de encuentro >135 grados | A menudo invisibles | Pérdida 5-15% (en el mejor de los casos) |
Líneas de soldadura en frío Se produce cuando los frentes de flujo se han enfriado considerablemente antes de encontrarse, algo habitual al final del llenado, en secciones de paredes delgadas o con trayectorias de flujo largas. La capa de polímero ya se ha solidificado, dejando solo un núcleo fundido muy delgado para la unión. El resultado es una muesca pronunciada en la superficie y una grave pérdida de resistencia.
Líneas de soldadura en caliente Se forma cuando los frentes se encuentran mientras aún están completamente fundidos, lo que suele ocurrir en una fase temprana de la secuencia de llenado. La difusión molecular y el entrelazamiento de las cadenas son mejores, pero siguen estando muy por debajo de los niveles del material a granel, ya que las cadenas del frente que avanza están orientadas y tienen una movilidad limitada perpendicular al flujo.
Unir líneas son una subclase especial en la que los frentes se unen en un ángulo elevado (superior a aproximadamente 135 grados) y a temperaturas cercanas o superiores al punto de fusión. El ángulo agudo de unión favorece una mejor mezcla y una mayor densidad de entrelazamiento, lo que da lugar a propiedades mecánicas sustancialmente mejores que las de las líneas de soldadura típicas.
Sensibilidad de los materiales: cómo se comportan los distintos plásticos ante las líneas de soldadura
La resistencia de la línea de soldadura depende en gran medida del polímero base. Los materiales amorfos, semicristalinos y con relleno se comportan de forma totalmente diferente en el plano de soldadura:
| Material | Tipo | Retención de la resistencia de la línea de soldadura (%) | Comportamiento clave |
|---|---|---|---|
| PA66 (sin relleno) | Semicristalino | 75-85% | Buena resistencia de la soldadura; los enlaces de hidrógeno favorecen la recuperación |
| PA66 GF30 | Semicristalino + GF | 50-60% | Las fibras se orientan en paralelo a la línea de soldadura — sin formación de puentes |
| PA6 | Semicristalino | 70-80% | Al igual que en el caso del PA66, una Tg ligeramente inferior contribuye a que |
| PP (sin relleno) | Semicristalino | 80-95% | Excellent weldability; slow crystallization aids healing |
| PP GF30 | Semicristalino + GF | 45-55% | Glass fibers severely degrade weld strength |
| PC (sin rellenar) | Amorfo | 85-95% | Best unfilled weld retention; high melt strength |
| POM | Semicristalino | 60-75% | Fast crystallization hurts; high mold temp helps |
| ABS | Amorfo | 80-90% | Good weld retention; rubber phase helps toughness |
| PPS GF40 | Semicristalino + GF | 35-50% | Worst-case weld strength; avoid structural welds |
The critical takeaway: glass fiber reinforcement amplifies weld line weakness. Fibers at the weld plane align parallel to the interface rather than bridging across it, so the weld region behaves essentially like the unfilled matrix — minus the fiber reinforcement the part was designed to rely on. A PA66 GF30 part may drop from 180 MPa tensile strength to 90-110 MPa at the weld line.
Weld Line Prediction Using Moldflow Simulation
Modern DFM (Design for Manufacturability) workflows make weld lines predictable before steel is cut. Autodesk Moldflow and similar simulation packages can identify all weld line locations during the filling analysis phase. If you want to see how those reports are interpreted, our mold flow analysis and DFM guide breaks down the most useful outputs.
Key Moldflow outputs to examine in your DFM report:
- Weld line result plot: Displays all weld line locations as colored lines. Pay attention to lines in high-stress regions identified by your FEA.
- Temperature at flow front result: The single most important predictor of weld line quality. If the temperature at flow front at the meeting point is above the material’s no-flow temperature, you are in hot weld line territory. Below it, expect a cold weld line.
- Meeting angle: Angles below 90 degrees produce poor entanglement. Angles above 135 degrees are merge-line territory. Most Moldflow packages display this as a numerical overlay.
- Fill time contour: Check whether both flow fronts arrive simultaneously. A time differential means one front is stagnant while the other advances, worsening the weld.
- Air trap result: Weld lines and air traps often coincide. A trapped air pocket at the weld location can create additional voids and burn marks.
A thorough DFM report should flag every weld line location, classify it by predicted severity (temperature + angle + stress location), and recommend specific mitigation for lines in structurally critical zones.
Prevention Strategies: Design-Level Solutions
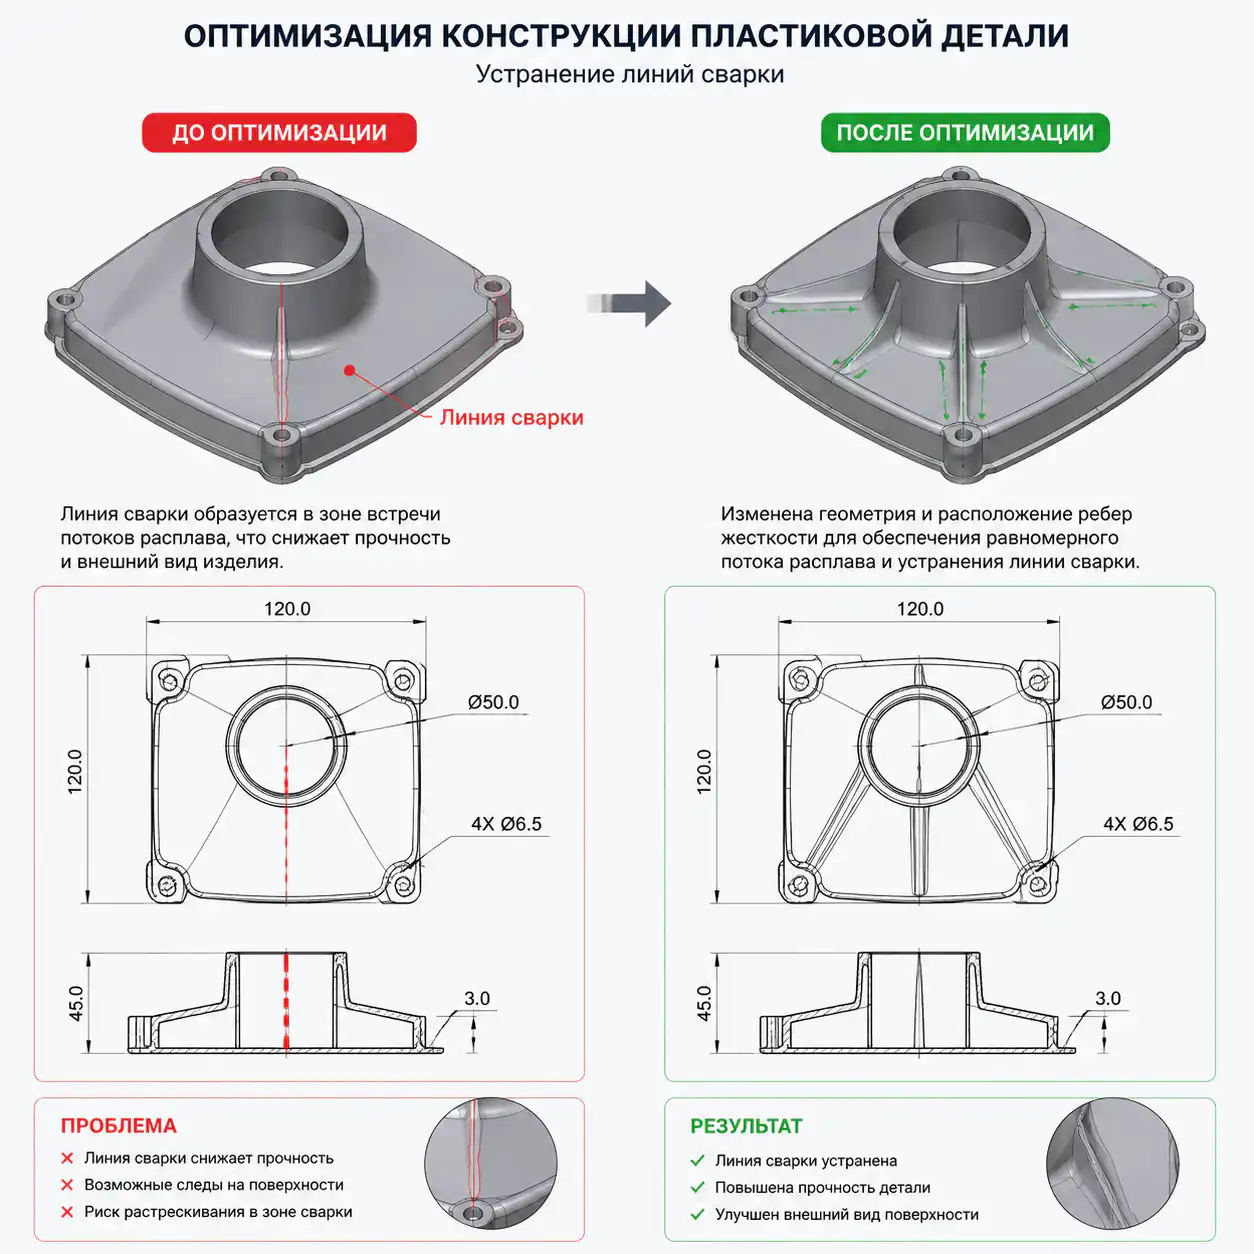
Preventing weld lines at the design stage is always cheaper than compensating through processing. Here are the primary design-level strategies, ranked by effectiveness:
1. Gate Relocation
The single most powerful lever. Moving the gate changes the entire flow pattern. Relocate gates so that weld lines shift to low-stress, non-cosmetic regions of the part — or, ideally, to the very end of fill where they exit into an overflow well. Even a 5 mm gate position shift can dramatically alter weld line location and severity.
2. Wall Thickness Optimization
Eliminate abrupt thickness transitions that cause differential flow rates. Gradual transitions (3:1 ramp rule) allow flow fronts to stay better synchronized. In multi-thickness parts, consider localized thinning or thickening to steer the weld line position.
3. Flow Leaders and Deflectors
Flow leaders are local wall thickness increases that create preferential flow paths, steering the melt to arrive at the meeting point simultaneously and at higher temperature. This is a targeted, low-cost mold modification compared to gate relocation.
4. Overflow Wells
Position overflow tabs or wells at the weld line location. The weld line forms inside the overflow, which is then trimmed off post-molding. This is the nuclear option — it eliminates the weld line from the functional part entirely — but adds material waste and a secondary trimming operation.
5. Sequential Valve Gating
For multi-gate molds, sequential valve gating opens gates in a programmed sequence rather than simultaneously. This creates a single continuous flow front that sweeps across the cavity, eliminating multi-gate weld lines. The cost is higher tooling complexity and controller hardware, but for large structural parts (automotive bumper beams, instrument panel carriers), it is the standard approach.
Processing Fixes: Optimizing Weld Line Strength Through Parameters
When mold modifications are not feasible (existing tooling, budget constraints, or tight timelines), processing adjustments can improve weld line strength by 10-30%:
| Parámetro | Direction | Effect on Weld Line | Limitaciones |
|---|---|---|---|
| Temperatura de fusión | Increase 10-20 degrees C | Higher temp = better molecular diffusion at meeting plane. Strongest single processing lever. | Material degradation risk, longer cycle time, flash |
| Temperatura del molde | Increase 10-30 degrees C | Slows skin freezing; more time for chain entanglement before solidification | Longer cycle time, dimensional stability concerns |
| Velocidad de inyección | Increase (faster fill) | Reduces cooling during filling; fronts meet hotter. Also increases shear heating. | Jetting, burn marks, gas traps, flash |
| Presión de mantenimiento | Increase + extend time | Compresses the weld zone; reduces voids and improves density | Flash, overpacking, molded-in stress |
| Contrapresión | Moderate increase | Better melt homogeneity; consistent viscosity aids predictable flow front behavior | Excessive shear heating, fiber breakage in GF materials |
Practical processing sequence for weld line optimization: Start by raising melt and mold temperature to the upper end of the material supplier’s recommended range. Then increase injection speed incrementally while watching for flash and burn marks. Finally, dial in holding pressure and time using short-shot studies to confirm the weld line zone is fully packed. This sequence typically recovers 15-25% of the lost weld strength — not a replacement for good design, but often the difference between passing and failing a structural test.
Testing Weld Line Strength
Verifying weld line performance requires targeted testing. Standard material datasheet values assume no weld lines, so they are dangerously misleading for parts with significant weld zones:
Tensile Testing (ISO 527 / ASTM D638)
Mold tensile bars with the weld line at the gauge center (use a film gate at both ends). Compare weld-line specimen strength to unwelded control specimens from the same mold. The ratio gives you actual weld line strength retention for your material, mold, and process combination. This should be standard procedure for any structural part with weld lines.
Impact Testing (ISO 179 / ASTM D256)
Weld lines are especially damaging to impact strength — often showing 70-90% reduction even in materials with good tensile weld retention. Charpy or Izod specimens notched at the weld line location provide critical safety validation for parts subject to shock loading.
Visual Inspection Standards
For cosmetic surfaces, establish clear accept/reject criteria. Dimensional standards like DIN 16742 provide classification systems for weld line visibility. Generally: Class A surfaces (visible in use) should show no visible weld line groove under specified lighting; Class B surfaces (visible but non-cosmetic) allow a faint line; Class C surfaces (hidden) have no cosmetic restriction but still require mechanical validation. Surface texture and gloss targets also matter here, which we cover in the Guía sobre el acabado de superficies.
For detailed PA66 GF30 properties and grade selection, see our glass-filled nylon grade comparison guide covering GF15, GF30, and GF60 stiffness, heat, warpage, and molding data.
Preguntas frecuentes
¿Las líneas de soldadura son siempre un problema o, en ocasiones, pueden ser aceptables?
Weld lines are not universally catastrophic. In non-structural, non-cosmetic regions of a part they are often acceptable without modification. The key question is: Is the stress at the weld line location below the reduced strength of the weld zone? In a PC enclosure with a hole for a cable pass-through in a low-stress area, a weld line is likely fine. In a PA66 GF30 engine mount bracket with the weld line at the bolt hole — where vibration and tensile loads concentrate — it is almost certainly a failure risk. Always apply the location-based risk assessment: stress level at weld line multiplied by weld strength retention equals actual safety factor. If that safety factor is below your design requirement, the weld line is unacceptable.
¿Cuánta resistencia pierde una línea de soldadura en el PA66 GF30?
In PA66 with 30% glass fiber, tensile strength at the weld line typically drops to 50-60% of the unwelded material strength. For a typical PA66 GF30 with 170-190 MPa tensile strength, the weld line zone strength is approximately 85-115 MPa. Impact strength reduction is even more severe — often down to 20-30% of the unwelded value — because glass fibers at the weld plane provide essentially zero bridging across the interface. The polymer matrix alone must carry the load. This is why GF materials demand the most aggressive weld line mitigation strategy, and why weld line location must be a primary consideration during gate placement design for any glass-filled material.
¿Es posible eliminar por completo las líneas de soldadura?
In parts with holes, inserts, or multiple gates, weld lines cannot be completely eliminated in a physical sense — you are always splitting and recombining flow. However, you can effectively eliminate their mechanical impact through: (1) Overflow wells that shunt the weld line into a disposable tab, physically removing it from the functional part. (2) Sequential valve gating that creates a single uninterrupted flow front for multi-gate parts. (3) Design changes that shift the weld line to a non-structural zone where strength reduction is irrelevant. The phrase “weld-line-free part” in DFM reports usually means “no weld line in any functionally critical location,” not literal absence.
¿Qué grado de precisión tiene Moldflow a la hora de predecir la ubicación de la línea de soldadura?
Moldflow weld line location prediction is highly reliable — typically within 1-3 mm of the actual position on the molded part when the mesh is properly refined and process settings match production. The location accuracy comes from the solver’s ability to track flow front advancement, which is fundamentally correct physics. Strength prediction is less reliable and should be treated as a comparative ranking tool, not an absolute predictor. Moldflow’s weld line strength outputs are based on empirical correlations with meeting angle and temperature at the flow front and should be validated with physical tensile bar testing for safety-critical applications. For DFM purposes: trust the location, verify the strength prediction with real molded specimens.